Many online articles about MySQL slow query configuration are outdated or duplicated. This guide provides clear, actionable instructions for enabling and analyzing slow query logs on CentOS systems running MySQL 5.5 and above.
Enabling MySQL Slow Query Logs
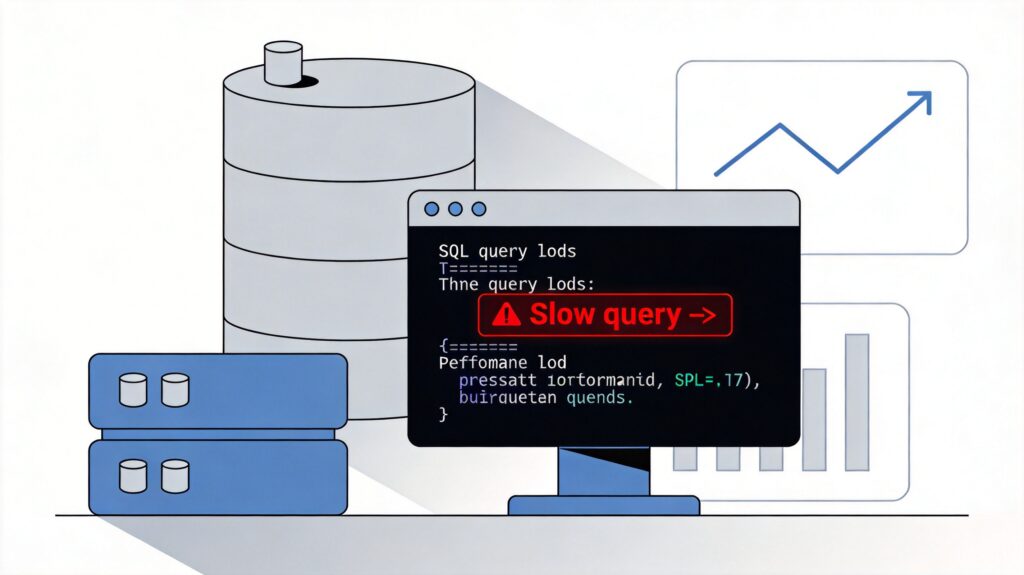
Slow query logs record SQL statements whose execution time exceeds a specified threshold, making them essential for database performance optimization.
1. Modify the MySQL Configuration File
Open the main MySQL configuration file with a text editor (e.g., vi):
vi /etc/my.cnfAdd the following parameters at the end of the [mysqld] section:
slow_query_log = 1
slow_query_log_file = /var/log/mysql/slow_query.log
long_query_time = 2
log_queries_not_using_indexes = 1
Parameter Explanation:
slow_query_log = 1: Enables the slow query log.slow_query_log_file: Specifies the full path for the log file. Ensure the MySQL process user (typicallymysql) has write permissions.long_query_time = 2: Defines the "slow" threshold in seconds. Adjust based on your needs.log_queries_not_using_indexes = 1: Logs queries not using indexes, even if they finish quickly, helping identify missing indexes.
Note: The old parameter log-slow-queries is deprecated in MySQL 5.5+. Use the new parameters for compatibility.
2. Restart MySQL Service
After saving the file, restart MySQL:
# CentOS 6
service mysqld restart

# CentOS 7+
systemctl restart mysqld
Using restart is more reliable than reload to ensure all changes take effect.
3. Verify the Slow Query Log
Log into MySQL and check the status:
SHOW VARIABLES LIKE 'slow_query%';
SHOW VARIABLES LIKE 'long_query_time';
Or, check the log file directly:
tail -f /var/log/mysql/slow_query.logImportant: Enabling slow query logs (especially for queries without indexes) can generate large files. Enable only during troubleshooting and adjust parameters as needed.
Analyzing Logs with mysqldumpslow
MySQL includes the mysqldumpslow tool to parse and summarize slow query logs.
1. Locate the Tool
Find the tool using:
find / -name mysqldumpslow 2>/dev/nullCommon paths are /usr/bin/mysqldumpslow or within the MySQL bin/ directory.
2. Common Usage Examples
Assuming the tool is at /usr/bin/mysqldumpslow and the log is at /var/log/mysql/slow_query.log:
- Top 10 slow queries by count:
/usr/bin/mysqldumpslow -s c -t 10 /var/log/mysql/slow_query.log - Top 10 by average query time:
/usr/bin/mysqldumpslow -s t -t 10 /var/log/mysql/slow_query.log - Top 10 by average lock time:
/usr/bin/mysqldumpslow -s l -t 10 /var/log/mysql/slow_query.log - Queries containing a pattern (e.g., 'LEFT JOIN'):
/usr/bin/mysqldumpslow -g "LEFT JOIN" /var/log/mysql/slow_query.log
3. Key mysqldumpslow Parameters
-s ORDER  Sort order: c (count), t (time), l (lock time), r (rows).
          Prefix with 'r' for reverse order (e.g., -s rt).
-t NUM    Show only top NUM results.
-a        Do not abstract numbers/strings.
-g PATTERN Filter using a regex pattern.
--help    Show full help.
Advanced Analysis with pt-query-digest
For deeper analysis, use pt-query-digest from Percona Toolkit. It provides detailed reports with query time distributions and index suggestions.
Install Percona Toolkit:
# CentOS 6/7
sudo yum install https://repo.percona.com/yum/percona-release-latest.noarch.rpm
sudo yum install percona-toolkit
Basic Usage:
# Analyze log and generate report
pt-query-digest /var/log/mysql/slow_query.log > slow_report.txt

# View report
cat slow_report.txt
The report includes the most time-consuming queries, execution time histograms, and index recommendations.
Summary
Enabling and analyzing MySQL slow query logs is fundamental for performance tuning. The key steps are: 1) Configure my.cnf and restart MySQL; 2) Use mysqldumpslow for quick analysis; 3) Use pt-query-digest for in-depth analysis. Regularly reviewing and optimizing queries found in the logs will significantly improve database performance.